

Why this exists
Any large language model (LLM) can describe a wildfire, a flood, or a dying forest. ASKTERRA Geospatial Agent looks at the actual satellite record and hands you the map, the chart, or the report — measured, not made up.
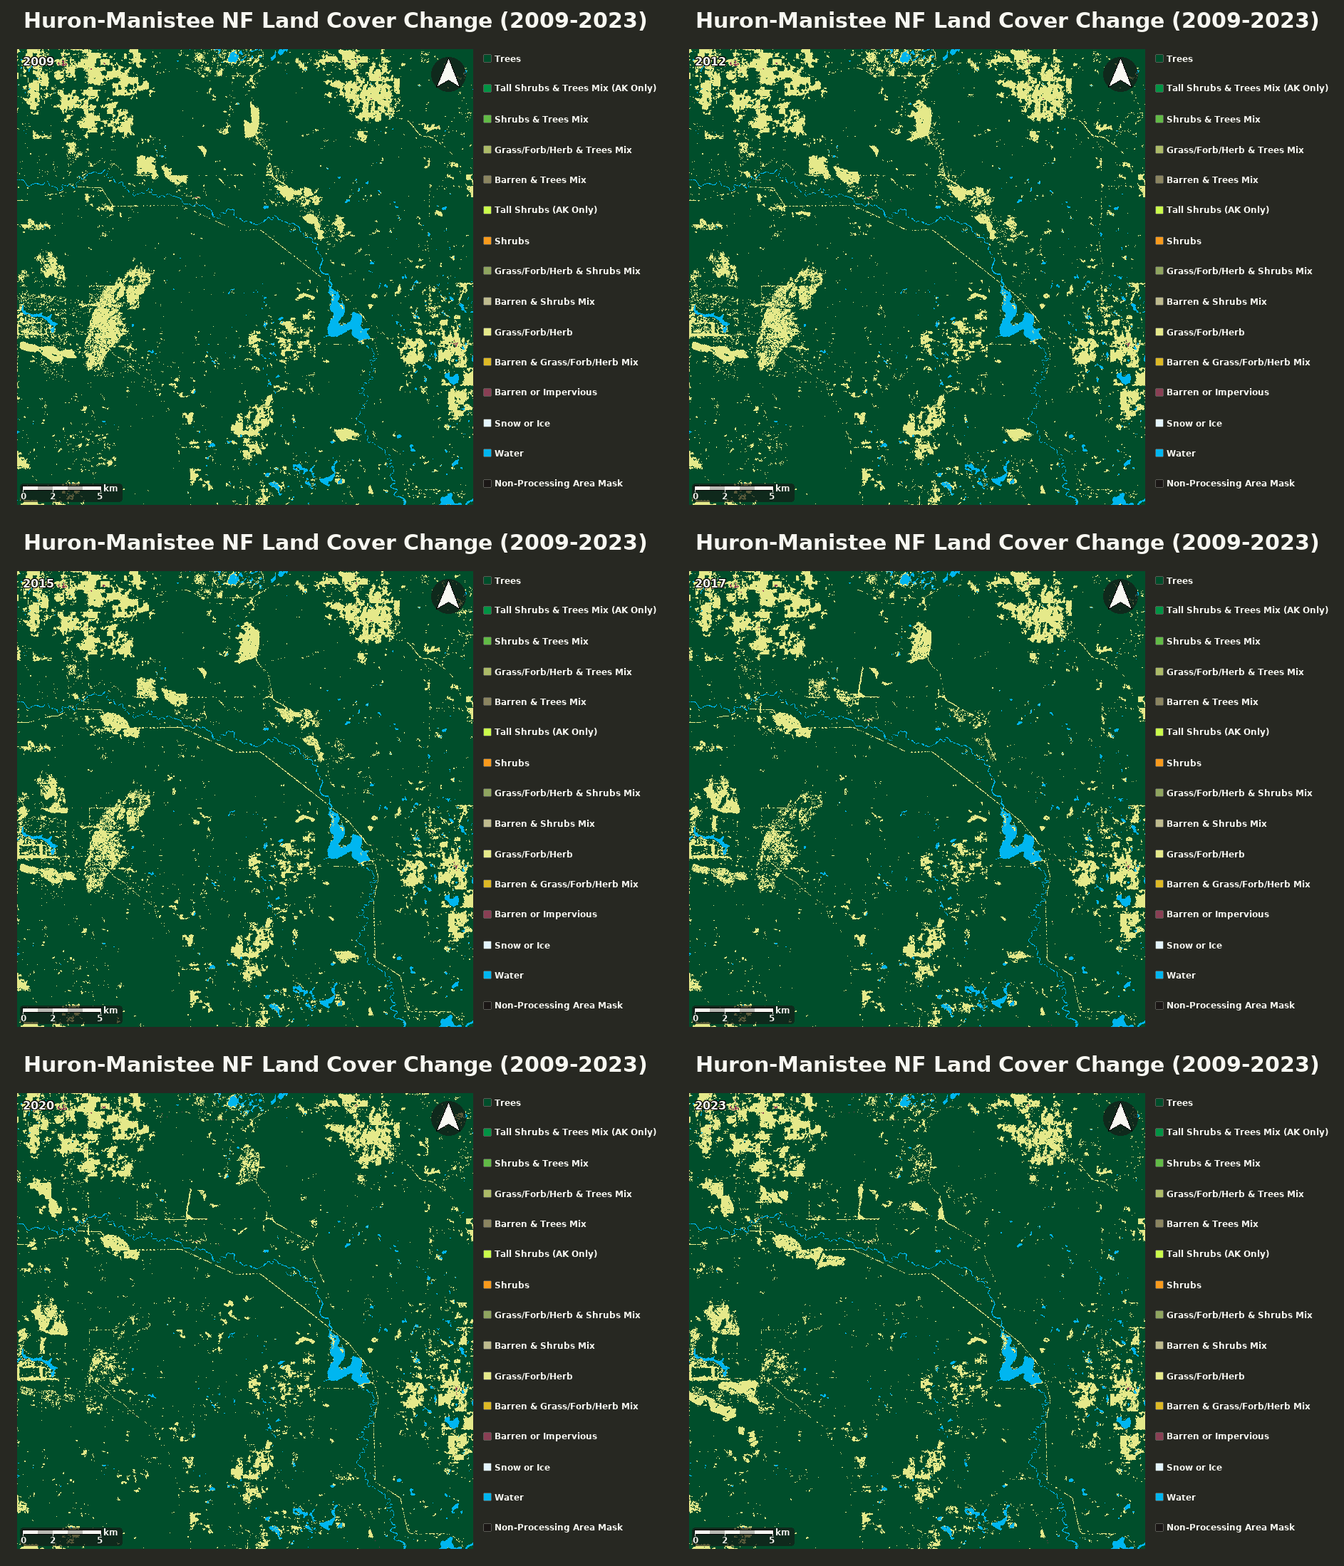
The gap
Most assistants were trained on pictures of Earth. They can write a paragraph about deforestation in Brazil or sketch a map that looks plausible. They cannot open yesterday's imagery, measure the burned acres, and give you a file you would put in a briefing.
That is the gap this framework fills. It sits between a conversation and the world's live Earth data, and it returns the kind of product an analyst would make — a map you can pan, a chart you can cite, a report you can send. What you're using now is one branded instance of that framework.
What changes
How it feels
"Show me how this forest changed from 1985 to last year." No GIS training. No code.
The agent picks the right imagery, runs the analysis, and builds the legend — against live data, not a guess.
An interactive map, a chart, a time-lapse, or a report. A stable link you can send to a colleague.
What you walk away with
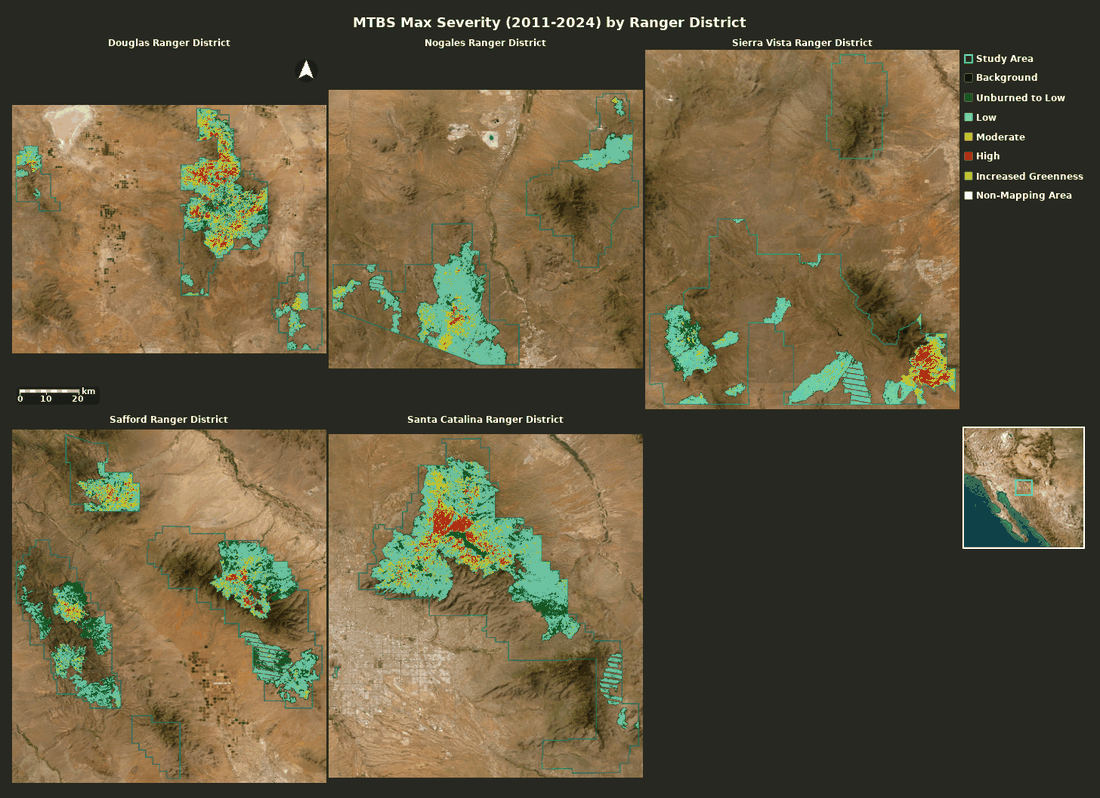
Turn layers on and off. Click a pixel. Draw an area and get the numbers. Every map is a link you can share.
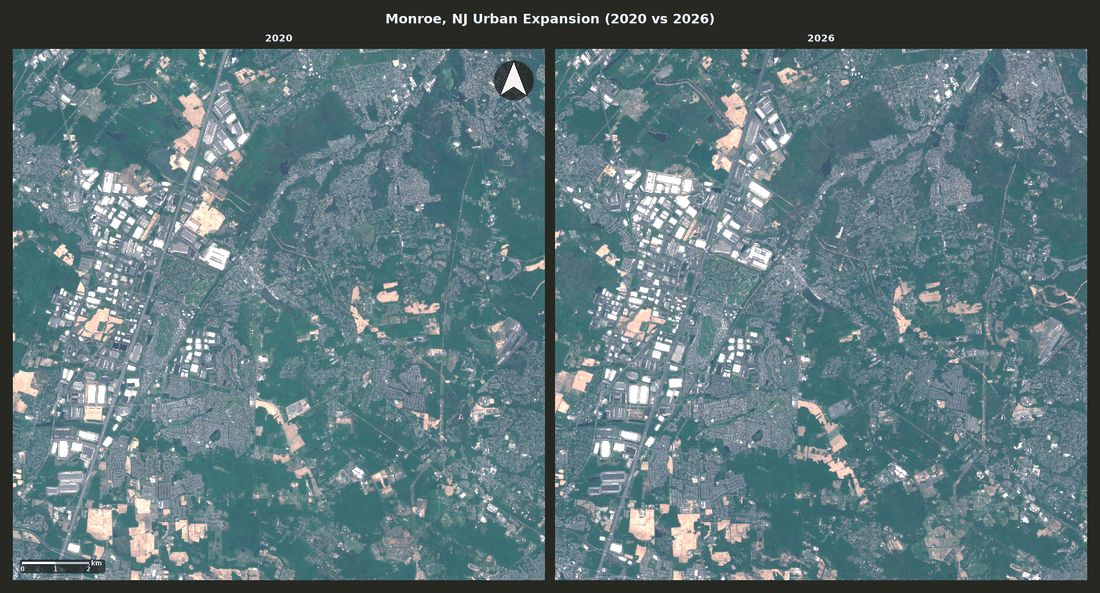
See what changed, when, and by how much. Side-by-side years, time-lapses, and charts of acres gained or lost.

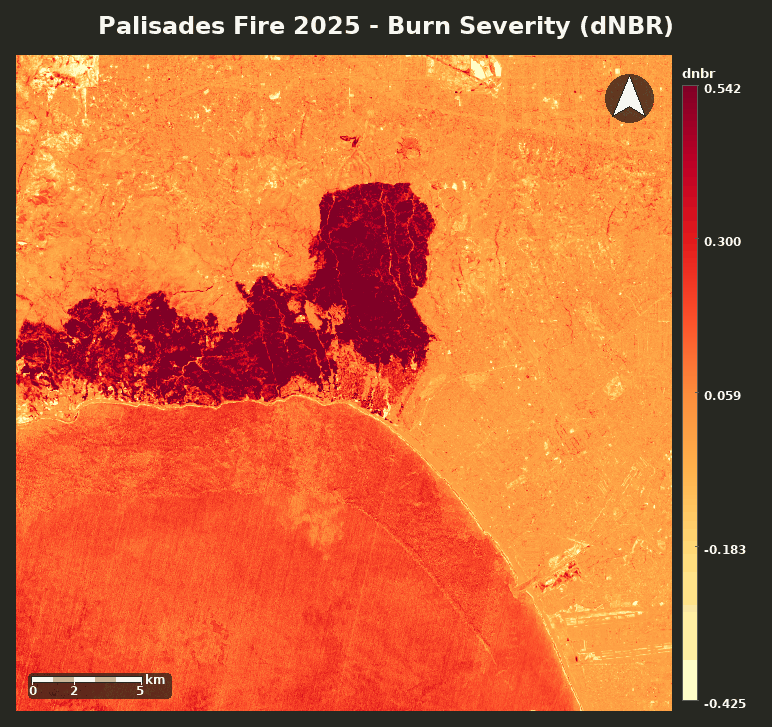
Legends, scale bars, locators. Stills and GIFs that look like they came from a cartographer, not a chat window.
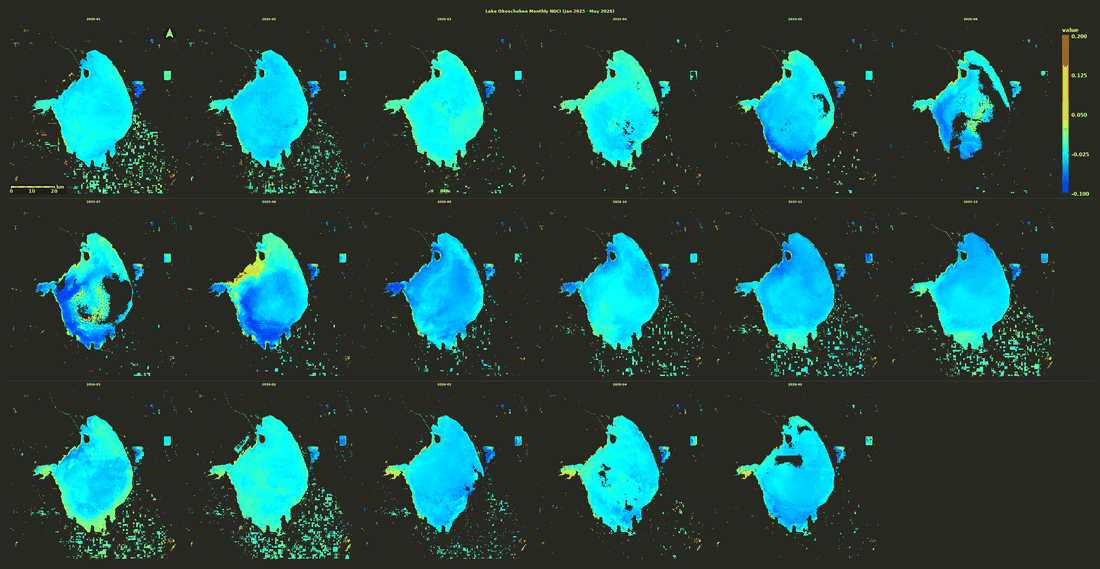
Maps, charts, tables, and a short narrative that explains the numbers. Ready to email in one ask.
Fire, drought, snow, floods, air quality, weather. If satellites still collect it, you can ask about it.
Turn a good analysis into a recipe. Re-run it on a new county or a new year without starting from scratch.
Who it's for
The same conversation works across forests, farms, cities, and supply chains. These are the kinds of questions people actually ask.
How badly did it burn. How the forest is coming back. Where cover has been lost.
Try"Map burn severity on the Lolo National Forest over the last ten years, and show acres in each class."
Vegetation crowding a power line. Damage after a storm. Whether a site is even feasible.
Try"Where did vegetation die back along this transmission line this summer?"
Snow that is still on the ground. Flood water on last night's radar. Algae in a reservoir.
Try"Which watersheds in the upper Colorado still had snow in April, 2020 to 2024?"
How this season compares to a normal year. Where crops are stressed. Where irrigation actually is.
Try"Compare this year's corn-belt greenness to a five-year average. Which counties are furthest behind?"
Heat, drought, air, ocean temperature, pressure on a protected area.
Try"Show drought over the Powder River basin, month by month, for the last five years."
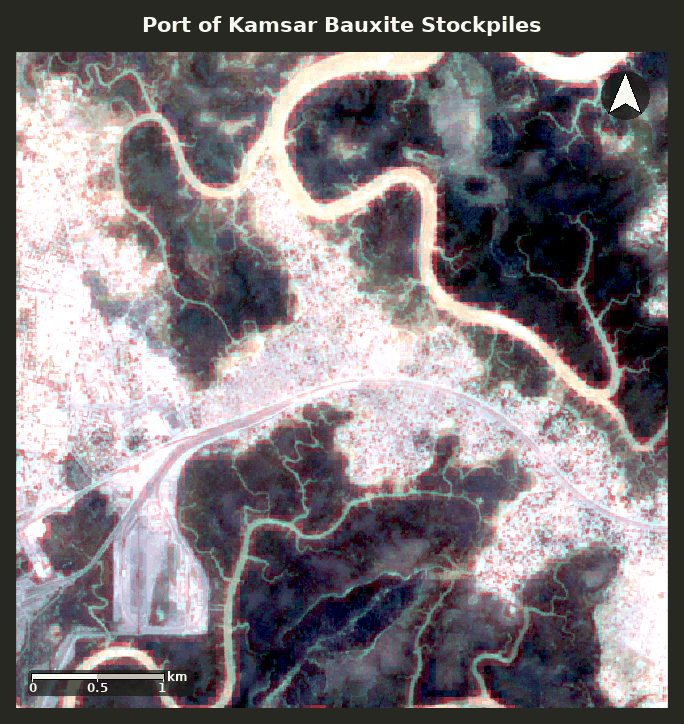
Stockpiles at a port. A mine face moving. New roads or pads showing up upstream of a mill.
Try"How has the bauxite stockpile at the Port of Kamsar changed over the last two years?"
Where the city grew. New pavement. Heat in neighborhoods. Vacant lots that filled in.
Try"Show new built area in Maricopa County from 2017 to 2024."
Which properties sat inside a fire perimeter. Flood overlap. Damage after the event.
Try"Which ZIP codes in California fell inside large fire perimeters in the last five years?"
What changed at a site. Activity you can see from radar when clouds hide the view. Damage after an event.
Try"Flag any new construction in this area since January."
Ways to use it
This is not a single product you have to buy a certain way. Use the chat you are in, plug the same capability into an assistant you already have, or put your name on a copy for your team.
A geospatial analyst your people can talk to today. Session memory, saved recipes, maps and reports as links. What you are using right now.
Do not replace your corporate agent. Let it ask this one when the question is about a place on Earth, and get a real map back inside its own chat.
Your logo, your URL, your questions, your people. We operate it. You show it to customers or to your own org. Same engine as this instance.
Developers who already live in Cursor or Claude Desktop can also drop the geospatial toolbelt straight into that client. Details are in the docs.
Make it yours
What you're using right now is the ASKTERRA deployment, run by RedCastle Resources. Another organization gets the same kind of conversation, with their name on it, pointed at the questions their people actually ask.
Logo, colors, and language that match the rest of how you show up.
Starter prompts and tools aimed at the work your team already does.
Who can sign in. Who can see which analyses. Managed like the rest of your org.
Your URL. Your deployment. Not a generic chatbot with a map pasted in.
How we work
What you want to do, who will use it, what data you already have. About 45 minutes.
Chat, a hook into an agent you already run, a branded copy, or some mix. We map that to your cases.
A staging URL with your name on it. You sign in and run real questions, not demos.
Your domain, your people, monitoring. We keep operating it.
Why you can trust the answer
Every number and every pixel came from the satellite record. No invented statistics. No fake maps.
Save the analysis. Hand it to a colleague. Re-run it next season on new imagery.
The session is not a black box. You get the map, the chart, and the trail back to how it was made.
Open the chat and ask about a place you already care about. Or talk to us about a version with your name on it — or a hook into the assistant you already run.
 geeViz
 Google Earth Engine
 Google Gemini